
Ever wanted to hide secret messages or images in your data? That’s
what the surreal package does! It lets you create datasets
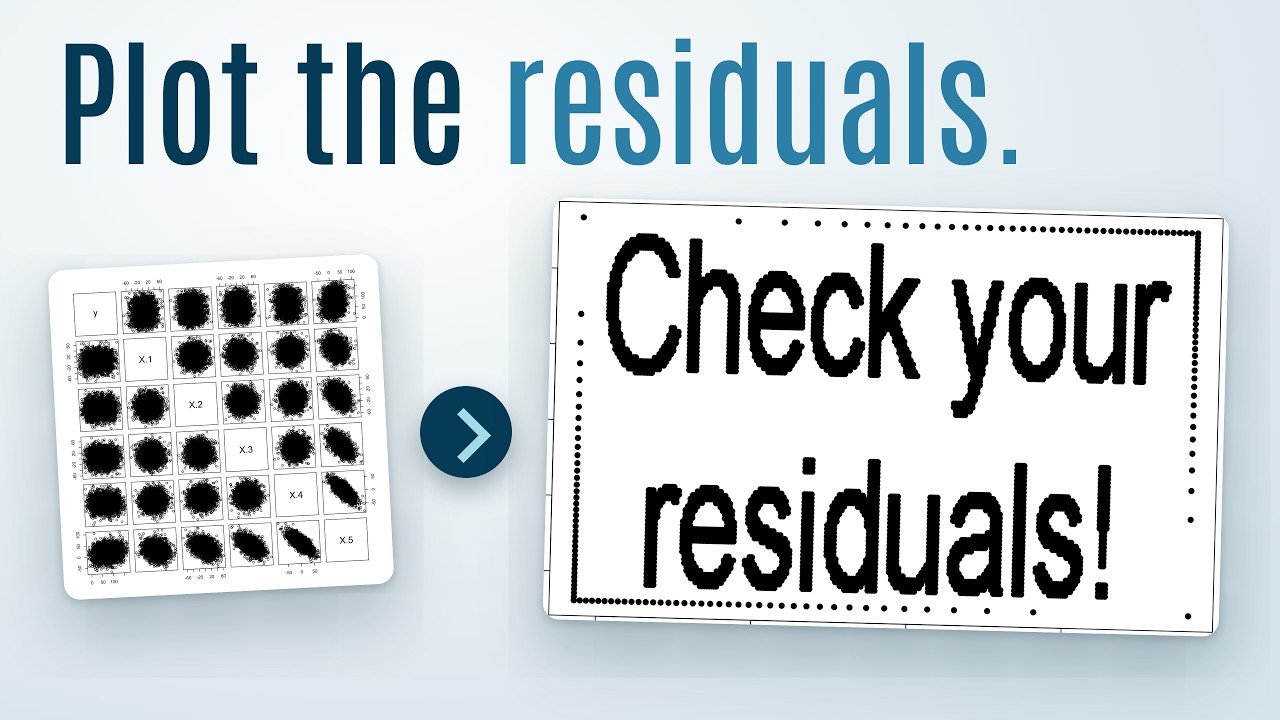
with hidden images or text that appear when you plot the residuals of a
linear model by providing an implementation of the “Residual
(Sur)Realism” algorithm described by Stefanski (2007).
You can try it right now in your browser, with nothing to install. The demo runs on Shinylive.
You can learn a bit more about the package in the following video:
You can install surreal from CRAN:
install.packages("surreal")Or get the latest version from GitHub:
# install.packages("remotes")
remotes::install_github("coatless-rpkg/surreal")First, load the package:
library(surreal)Once loaded, we can take any series of (x, y) coordinate
positions for an image or a text message and apply the surreal method to
it.
As an example, let’s use the built-in R logo dataset:
data("r_logo_image_data", package = "surreal")

plot(r_logo_image_data, pch = 16, main = "Original R Logo Data")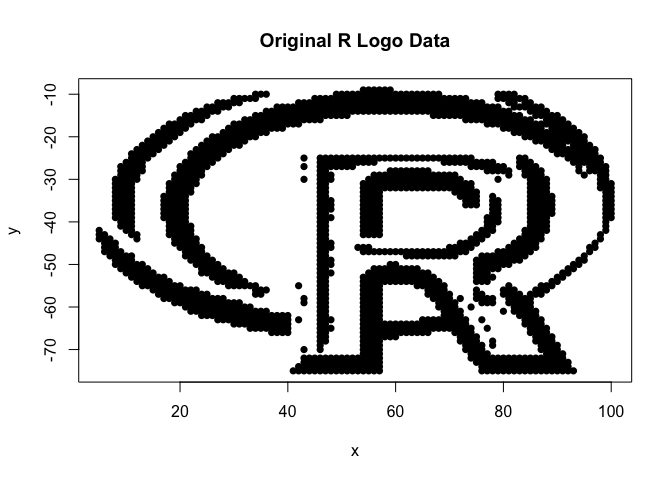
The data for the R logo is stored in a data frame with two columns,
x and y:
str(r_logo_image_data)
#> 'data.frame':    2000 obs. of  2 variables:
#>  $ x: int  54 55 56 57 58 59 34 35 36 49 ...
#>  $ y: int  -9 -9 -9 -9 -9 -9 -10 -10 -10 -10 ...
summary(r_logo_image_data)
#>        x                y
#>  Min.   :  5.00   Min.   :-75.00
#>  1st Qu.: 32.00   1st Qu.:-57.00
#>  Median : 57.00   Median :-39.00
#>  Mean   : 55.29   Mean   :-40.48
#>  3rd Qu.: 77.00   3rd Qu.:-24.00
#> Max. :100.00 Max. : -9.00Now, let’s apply the surreal method to the R logo data to hide it in a dataset. We’ll want to set a seed for reproducibility purposes since the algorithm relies on an optimization routine:
set.seed(114)
transformed_data <- surreal(r_logo_image_data)
We can note that the transformed data has additional covariates that obfuscate the original image. If we observe the transformed data by using a scatterplot matrix graph, we can see that the new covariates do not reveal the original image:
pairs(y ~ ., data = transformed_data, main = "Data After Transformation")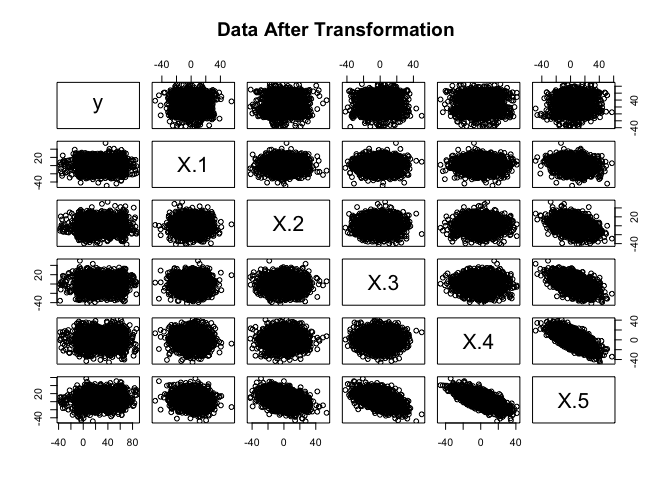
We need to fit a linear model to the transformed data and plot the residuals:
model <- lm(y ~ ., data = transformed_data)
plot(model$fitted, model$resid, pch = 16,
     main = "Residual Plot: Hidden R Logo Revealed")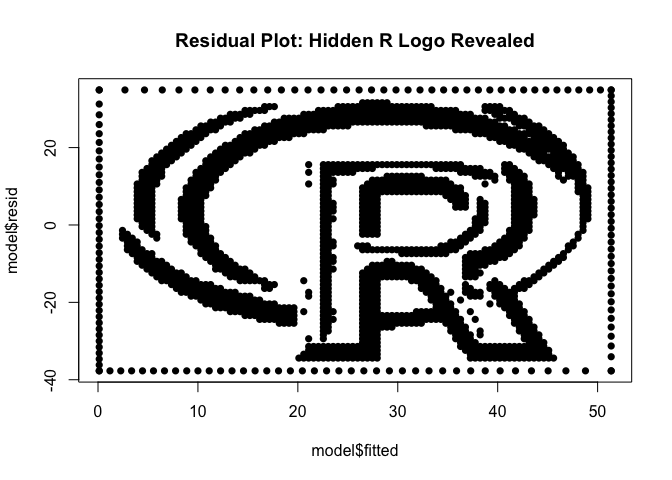
The residual plot reveals the original R logo with a slight border. This border is automatically added inside the surreal method to enhance the recovery of the hidden image in the residual plot.
Want to hide your own message? You can also create datasets with custom text:
# Generate a dataset with a hidden message across multiple lines
message_data <- surreal_text("R\nis\nawesome!")

# Reveal the hidden message
model <- lm(y ~ ., data = message_data)
plot(model$fitted, model$resid, pch = 16,
     main = "Custom Message in Residuals")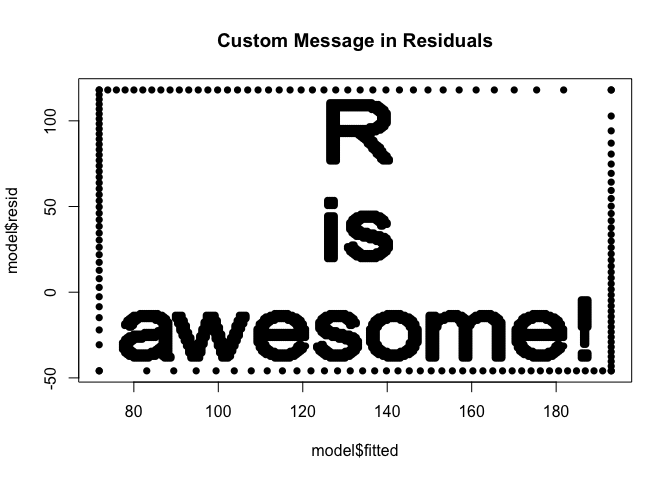
You can create surreal datasets directly from image files or URLs
using surreal_image():
# From a local file
result <- surreal_image("path/to/image.png")

# From a URL
result <- surreal_image("https://www.r-project.org/logo/Rlogo.png")

# Reveal the hidden image
model <- lm(y ~ ., data = result)
plot(model$fitted, model$resid, pch = 16)
The function supports PNG, JPEG, BMP, TIFF, and SVG formats, with automatic mode detection (dark/light) and threshold calculation.
For a point-and-click experience, launch the interactive Shiny app:
surreal_app()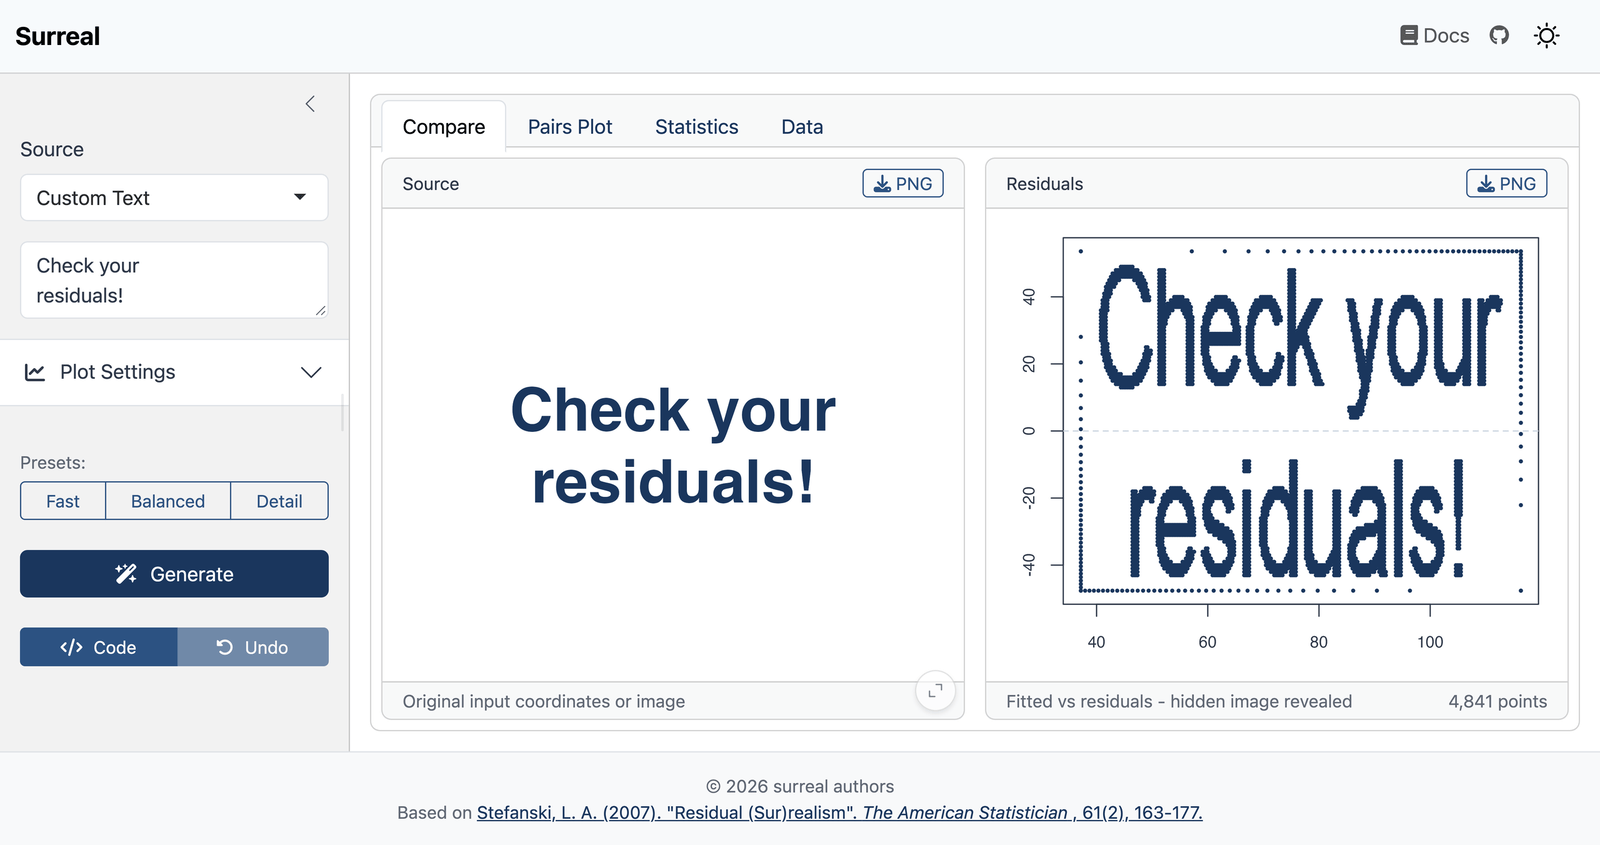
The app lets you:
You can also try the app in your browser, with nothing to install. The demo runs on Shinylive.
Stefanski, L. A. (2007). “Residual (Sur)realism”. The American Statistician, 61(2), 163-177. doi:10.1198/000313007X190079
This package is based on Stefanski (2007) and builds upon earlier R implementations by John Staudenmayer, Peter Wolf, and Ulrike Gromping.