


Time series forecasting in R that picks its model by what would have worked.
foresightr fits several models to a series, replays the
past to see how each would have done, chooses by out-of-sample error and
reports intervals taken from the errors actually observed, including
intervals for the total of the next k periods.
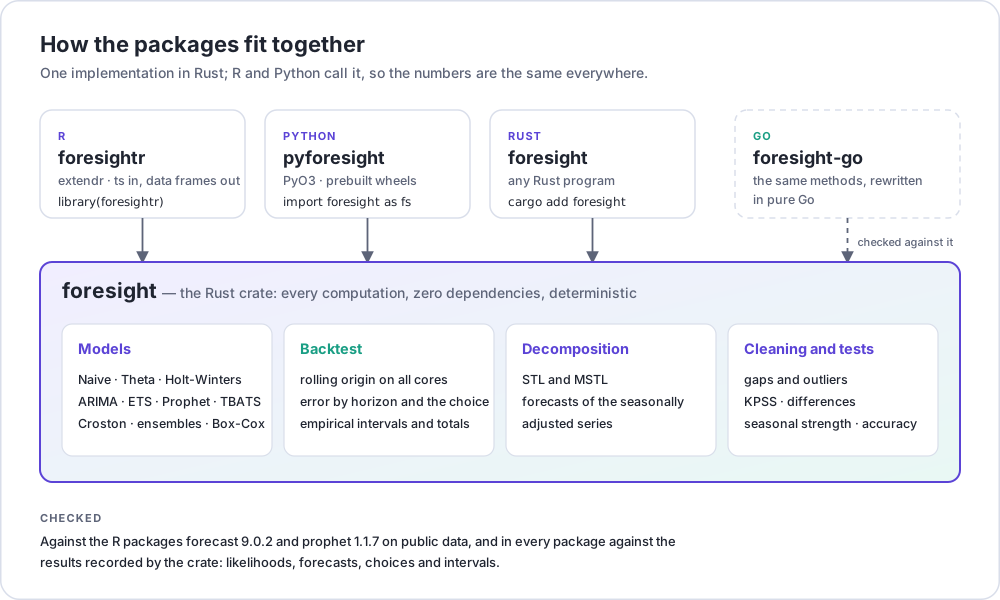
The models, the backtest and the utilities are the Rust crate foresight, compiled into
the package: the numbers are the crate’s and the backtest runs on all
cores (or as many as foresight_threads() allows). Charts
are drawn with ggplot2, the only dependency beyond base R.
Website: https://strategicprojects.github.io/foresightr/ · Português
# install.packages("remotes")
remotes::install_github("StrategicProjects/foresightr")
Installing from source compiles the Rust code, so it needs a Rust
toolchain (https://rustup.rs, version 1.81 or later); on Windows,
also the GNU target:
rustup target add x86_64-pc-windows-gnu. The crates it
depends on come with the package: nothing is downloaded.
library(foresightr)

# replay the last 36 months, 12 months ahead, with 11 models
bt <- backtest(AirPassengers)
bt                      # the ranking and the choice
bt$forecast             # the forecast with 80% and 95% intervals
total_forecast(bt, 6)   # the total of the next six months, with its own interval
autoplot(bt)            # a ggplot: history, forecast and intervals
autoplot(bt, "accuracy") # the error of the best candidates by horizon
A ts brings its seasonal period and the season of its
first observation; a plain vector needs period =.
One model on its own:
fit <- fit_model(model_log(model_airline()), AirPassengers)
predict(fit, h = 12)

auto <- fit_model(model_auto_arima(), log(AirPassengers))
auto$details$order; auto$details$seasonal_order; auto$aicc
A trend that bends, with dated events (positions from 1 at the first observation, future ones included):
model <- model_prophet(events = list(campaign = c(11, 35, 59, 83, 107, 131)),
                       steps = list(new_law = 81))
Several models combined, and the wider set of candidates:
backtest(y, c(candidates_thorough(),
              list(with_name(model_ensemble(candidates_default(), weighting = "stacked"),
"my_ensemble"))))| Piece | What it does |
|---|---|
| Models | model_mean(), model_naive(),
model_drift(), model_seasonal_naive(),
model_theta(), model_holt_winters(),
model_log_linear() (optionally deflated by a price index),
model_arima() and model_airline() (seasonal,
exact maximum likelihood, optionally with regressors),
model_auto_arima(), model_ets(),
model_auto_ets(), model_prophet()
(changepoints, Fourier seasonality, events and steps),
model_tbats() (several seasonal periods, not necessarily
whole numbers), model_croston() (with SBA and TSB) |
| Combinators | model_log(), model_box_cox() (λ fixed or
by Guerrero’s method), model_decomposed() (any model on the
seasonally adjusted series), model_ensemble() (average,
median, inverse error or stacked weights), with_name() |
| Candidates | candidates_default() (11 models),
candidates_thorough() (18) |
| Fitting | fit_model(), predict(),
forecast_model() |
| Backtest | backtest(), foresight_threads(): rolling
origin (expanding or fixed window) on all cores; MAPE, MAE, RMSE, MASE
and bias by horizon; average of the best models; choice by out-of-sample
error; empirical intervals by horizon and for totals
(total_forecast()) |
| Decomposition | decompose_stl(), decompose_mstl() |
| Cleaning | fill_gaps(), find_outliers(),
clean_series() |
| Tests and measures | kpss_statistic(), n_differences(),
n_seasonal_differences(), seasonal_strength(),
autocorrelations(), box_cox(),
inv_box_cox(), guerrero_lambda(),
mape(), pct_bias(), mae(),
rmse(), mase() |
| Regressors | fourier_terms(), seasonal_dummies(), or
any columns of your own |
| Charts | autoplot() / plot() of a backtest
(forecast, accuracy by horizon, ranking) or a decomposition, as ggplot
objects; theme_foresight() |
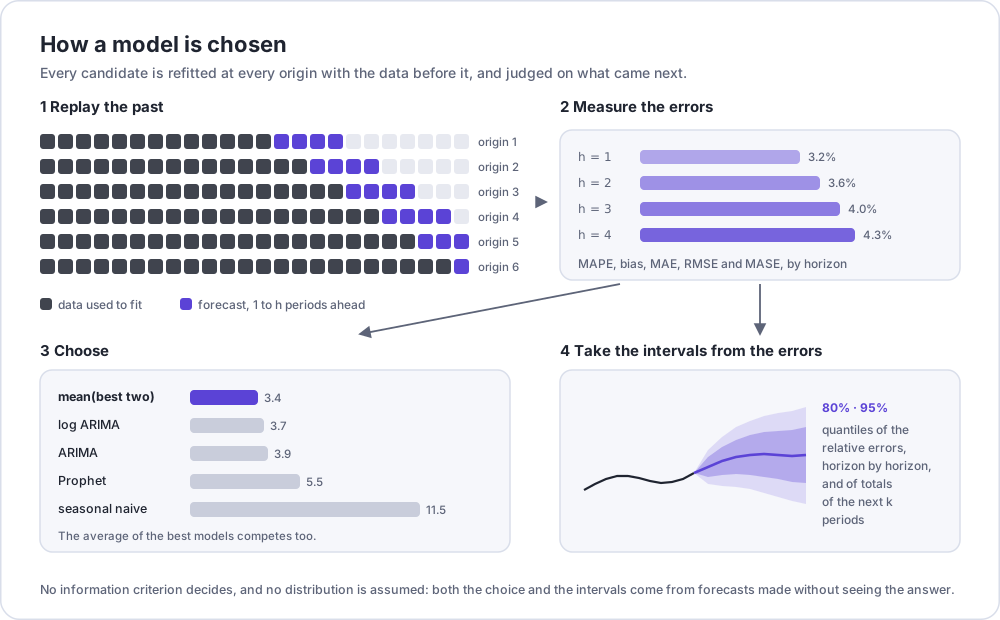
Most forecasting packages choose a model by an in-sample information criterion and derive intervals from distributional assumptions. Here the choice and the intervals both come from forecasts made without seeing the future they are judged against. The interval for a total (say, the rest of a fiscal year) is measured on totals, because adding up monthly limits overstates its uncertainty.
The package runs the Rust crate, so its numbers are the crate’s; the
tests check that nothing is lost on the way, against results recorded by
the crate: ARIMA, regression with ARIMA errors, ETS, Prophet, TBATS, STL
and MSTL, Croston, cleaning, ensembles, tests of stationarity and
seasonality, and the backtests of 11 and 18 candidates on three public
series. decompose_stl() is also compared with
stats::stl(). The crate itself is compared with the R
packages forecast 9.0.2 and prophet 1.1.7; the
same methods are available in Python (pyforesight)
and Go (foresight-go).
inst/extdata/piaui_revenue.csv has the monthly ICMS and
FPE revenue of the state of Piauí, Brazil (Siconfi/STN, with the IPCA
price index from the Central Bank of Brazil):
read.csv(system.file("extdata", "piaui_revenue.csv", package = "foresightr"), comment.char = "#")MIT.